Check in each week to get updates on our John Deere Field Connect weather station as we collect and analyze data. We will post updates on weather events, discus water levels in the soil profile, and demonstrate how to interpret the different graphs from the Field Connect website and cell phone app.

Thursday, June 30, 2016

Setting Budget Lines

This week we will look at budget lines and how to set them.  Budget lines are the full point and refill point in the soil profile.  The full point is the maximum amount of water we want in the soil.  Depending on the growth stage, we set that at 5% of the field capacity.  The capacity can be found after a rain or irrigation event when the water level spikes and then drains back out.  The point when the draining starts to level off is the field capacity.
In our demo field, the field capacity is 12.6 inches, so we set the full point at 11.97 inches.


We set the refill point at 70% of the field capacity.  Below you can see that as the water level gets below the refill point the graph begins to level out indicating that the plant is struggling to draw water from the soil.  


As the season goes on, these points will change due to crop needs.

Thursday, June 23, 2016

"Stepping"

With moisture sensors down to 40 inches, we can monitor root growth and watch water uptake at those depths.  We do this by watching "stepping" in the soil moisture graphs.  In our demo probe, we can see that the roots are drawing water at the four inch depth and we can see some slight stepping at the eight and twelve inch depths.
This is the same graph, but with the stepping highlighted in red.  Each step is the crop drawing the water level down.  The corn in this part of the field is currently around V5 and we should see these steps get bigger and see them at deeper depths as the roots grow deeper and begin drawing more water for the bigger plant.  As the soil water level goes down, you might see the steps get shallower or eventually level off.  This indicates that the moisture level is low enough at that depth the plant can no longer draw water from the soil. 
This is a graph from a previous year.  You can see that as the season progressed, that  roots were drawing water all the way down to the 40 inch sensor.  This graph also shows the stacked view of the soil moisture graph.  This view organizes the sensors by depth.  It is useful in seeing how deep the roots are and how deep water is soaking in after a rain or irrigation event.

Wednesday, June 15, 2016

Take a Look at Agronomic Data

With the environmental sensors installed, we can collect and calculate some valuable agronomic data.  To view this on the graph, select the agronomic data drop down menu at the top of the graph.

Select the data you want to view and then "update data" to change the graph.
The first one we will look at is the daily moisture change.  This shows how much water is being added or leaving the soil profile.  Red bars indicate the crop using water and will get bigger as the season progresses and the crops draw more water.  Green bars show water being added from irrigation or in this case, rain.

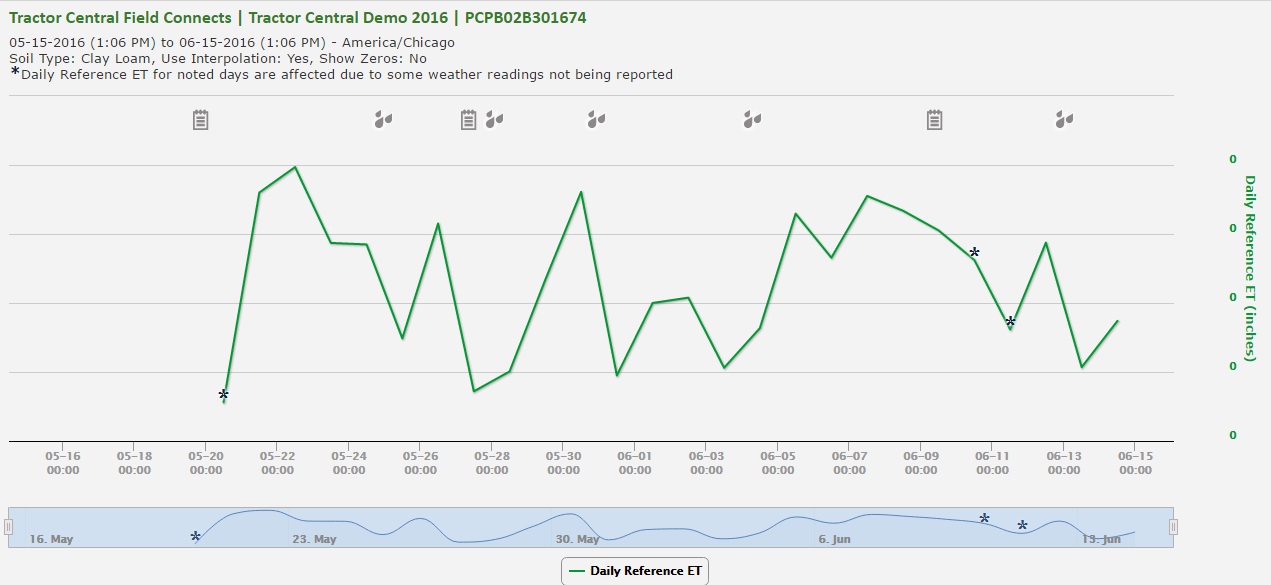
Next we will look at daily reference ET or evapotranspiration.  Evapotranspiration is the process of water being transferred from the ground to the atmosphere by evaporation from the soil surface and transpiration from the plants.  This is a calculated value taken from data collected by the Airmar® weather station and the pyranometer.  This information can be used for determining irrigation schedules.


This graph shows the growing degree days which is also a calculated value that uses heat units measured by the weather station.  This information can be used for estimating crop maturity.


This last image shows data from the rain gauge as well as the line graph from the moisture probe.  By looking at the rain data in this way, you can see how much water it takes to recharge the soil at different depths.  You can see in the graph below that 1/4 inch rains aren't soaking in much past the 8 inch depth.  In this soil, it took a 1"+ rain to register a change in moisture at the 40" depth.  At this point in the growth stage that may not be as important as later on when the roots have reached that depth, but that water can move up in the profile.  Later in the season we will see that water level draw down as the crops reach that depth or begin to pull it up in the profile.  

This data can also be valuable for irrigation management.  You would probably find that it is more efficient to apply more water at greater intervals than putting on a 1/4" and only soaking in 4-8" more frequently.  

The rain gauge can also be used to check pivot output.  If you are trying to apply 1" of water, you can check the rain gauge and see how it is actually performing.

You can study this data for yourself by logging into Tractor Central's demo Field Connect with the following username and password:

Username: tractorcentraldemo
Password: tractor1 

Contact us for more information by using the contact form on the right side of this page or calling one of our 10 locations.  


Tuesday, June 7, 2016

Navigating the Field Connect Website

When you log in to our Tractor Central Demo page, you will be first taken to the field monitor page.  This will show all of the Field Connects in your profile and give you a glance at the water levels in each of them.


 You can also take a look at any of the environmental sensors that are installed on that gateway.  Our demo Field Connect is outfitted with a rain gauge, soil temperature probe, pyranometer, and a weather station.  You view this information by clicking on the weather icon.
The most recent readings are displayed for most sensors.  The rainfall displayed is over the last 24 hours.  With the weather sensor attached we can also view the calculated values of  previous days evapotranspiration, cumulative GDD, and cumulative chill hours.
When you click on the water level bar or the graph icon you will be taken to graph page.
Here we see the "sum" graph.  This graph will show the total water measured by all five sensors and our budget lines.  We will discuss budget lines in a later post.  
There are different types of graphs available to view.  By clicking on the graph settings button, we can switch to line and stacked graphs.
This graph shows each sensor individually.  With this graph we are able to see how far each rain or irrigation event soaks into the ground as well as where the roots are pulling water from.  We will also discuss interpreting these graphs later as we get more data, but currently you can see that the 4" and 8" sensor are reading significantly lower than the others indicating an air pocket around the probe that needs to be fixed.
Weather information can also be viewed on these graphs by clicking on Agronomic Data button and selecting which information you want to view.  Feel free to log in to our demo site and look around at all of the field monitoring information available to you from anywhere you have an internet connection.  
Username: tractorcentraldemo
Password: tractor1