Now that we have a Field Connect system monitoring our soil moisture and weather conditions, the next step to being successful with it is monitoring the data we are collecting. Like a yield monitor, if you are going to collect data from your field, but if you aren't going to look at the data, what's the point? To get the most from the Field Connect system, it should be checked daily. Make it part of your morning routine...sit down for breakfast, check the weather, check the markets, and check the Field Connect. We have already discussed using the Field Connect website to view the soil moisture and weather conditions, but now we will take a look at the app. This can be downloaded for free from the
App Store or
Google Play. You will need to log on just like the website. (The images are from an iPhone. The Android app is similar.)
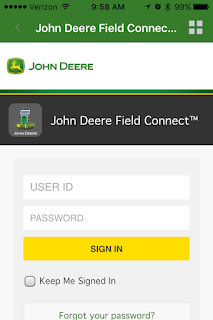 |
User ID: tractorcentraldemo
Password: tractor1 |
The first page you will see will show a quick glance of all of the Field Connects in your profile. In this case it is just the demo one.
If you click on the probe, it will bring up some more options:
Here you can click on the graph to view a few select graphs. The weather icon will show you recent weather data. The next icon will display gateway information like signal strength and battery info. The fourth will show any notes that have been entered, and the last will show alerts.
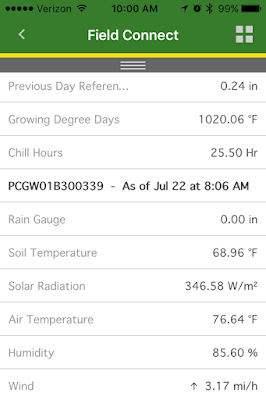 |
| The weather page will show the most recent data received. |
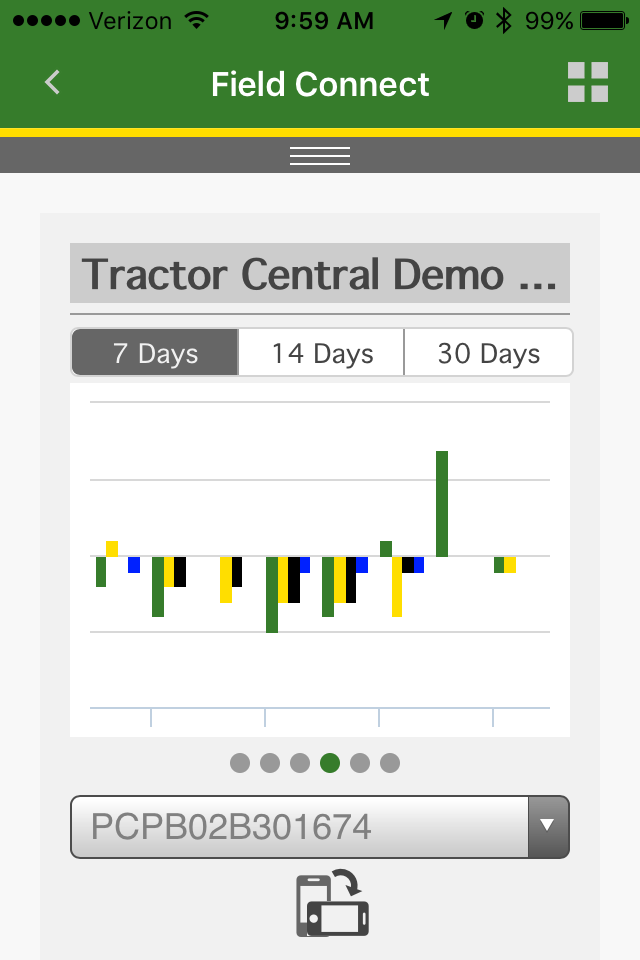
There are six graphs that you can view on the graphs page. You can look at 7, 14, or 30 days worth of data. Swipe left or right to switch graphs.
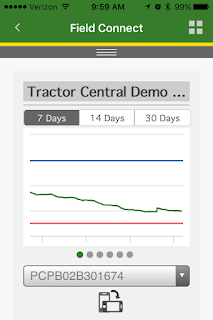 |
| Sum graph with budget lines |
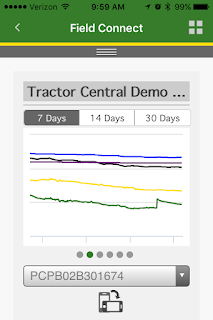 |
| Line graph |
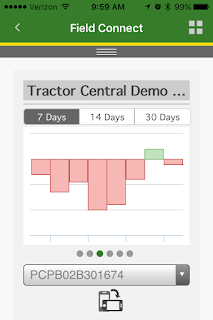 |
Daily moisture change
|
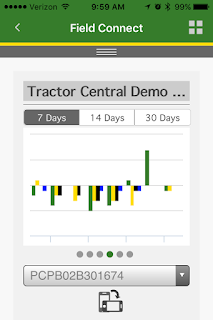 |
| Daily moisture change at each sensor |
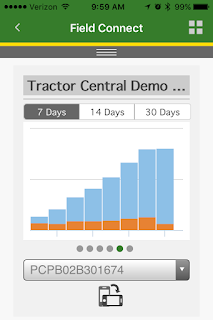 |
| Growing degree days |
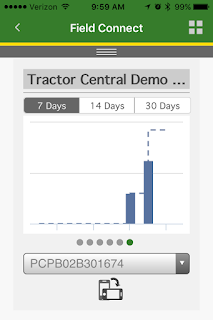 |
| Rainfall |
If you turn your phone on it's side you can see the legend and a little bigger graph.
The data in the app is somewhat limited but you can get a pretty good idea of whats going on in your field. If you see something you need to analyze further, you can log into the website for a more detailed look.


No comments:
Post a Comment